International Journal of Agriculture, Environment and Biotechnology
Citation: IJAEB: 13(1): 99-103, March 2020
DOI: 10.30954/0974-1712.1.2020.13
©2020 IJAEB All rights reserved
AGRICULTURAL ECONOMICS
Calibration and Validation of CERES-Wheat Model in North Eastern Plain Zone (NEPZ) of India
Manvendra Singh1*, G.C. Mishra1*and R.K. Mall2
1Section of Statistics, Department of Farm Engineering, Institute of Agricultural Sciences, BHU, Varanasi, India
2DST-Mahamana Centre of Excellence for Climate Change Research, Institute of Environment and Sustainable Development, BHU, Varanasi, India
*Corresponding author: manvendrastat66@gmail.com ( ORCID ID: 0000-0003-1018-9815)
Paper No.13
Received: 10-10-2019
Revised: 20-01-2020
Accepted: 25-02-2020
ABSTRACT
The crop growth model DSSAT (Decision Support Systems for Agrotechnology Transfer) used to simulate the weather parameters impacts on crop growth and yield. The experiment was conducted on Wheat crop in North Eastern Plain Zone of India. The main objective of the study was to evaluate wheat phenological stages and yield in major wheat growing zone of India. Among the parameters of the crop Yield and Days of flowering has been used for calibration and validation purpose. For the study CERES - Wheat model was used for the calibration and validation. Different data sets were used for the calibration and validation of the model. Methods of deviation statistics like Index of Agreement (d), RMSE and NRMSE are used to measure the efficiency of the model. For Yield it shows (d), RMSE and NRMSE values 0.961,199.25 and 5.17 respectively and for Days of flowering it shows (d), (RMSE) and NRMSE values are 0.970, 4.37 and 4.35 respectively. Study results shows that model is adequate to simulate the effects of climate change on wheat yield in North Eastern Plain Zone of India that are free from all pests. The model may also be used to improve and evaluate the current practices of wheat growth management to enhance wheat production.
Highlights
 Present study thus carried out for the calibration and validation of DSSAT -CERES Model in North Eastern Plain Zone of India for wheat crop.
Keywords: Wheat, Climate Change, DSSAT, CERES - model, calibration and validation.
India is the second most populous country in the world after China. It accounts for 2.4 % of world area with 16.9 % share in world population (http://censusindia.gov.in). Population of India is increasing at a alarming decadal growth rate of 17.7% (Census 2011). Cultivatable area is decreasing day by day due to population pressure. Agriculture plays a vital role in Indian economy. 54.6% of the population of our country is engaged in agriculture and allied activities (census 2011) and it contributes 17.2% to the country’s Gross value added (Indian economic survey report, 2016-17 series). The agriculture continues to play a pivotal role to the sustainable growth and development of the Indian economy.
Not only does it meet the food and nutritional requirements of 1.3 billion Indians, it contributes significantly to production, employment and demand generation through various backward and forward linkages. The area under wheat has steadily gone up since the start of the green revolution in 1965 and its production and productivity have increased tremendously. The wheat area has increased from 12.8 million-ha in 1966-67 to 30.42 million ha in 2017-18.
Since the year 1850, each of the last three decades has been warmer than any preceding decade (Jayaraman and Murari 2014) The mounting evidence across the world has unequivocally established that global warming is the result of unprecedented greenhouse gas emissions with in the last two centuries. The first part of the fifth Assessment Report (AR5) of the Intergovernmental Panel on Climate Change (IPCC) has clearly established this fact while explaining the physical science aspects of climate change (IPCC 2013). Agricultural sector provides 23% of Gross National Production (GNP) of our country and it is the important lively hood for nearly about 70% of the population. (Khan et al.2009). The large variability in topography, climate, cultivation and management practices increase the complexity of the climate change analysis.
MATERIALS AND METHODS
Study Site
A large number of experiments have been done where the effect of different agro-ecological factors such as season, weather, sowing dates and variety has been studied on growth and yield of wheat crop in different locations. Through an extensive literature search experiments were selected to get the inputs required for calibration and validation of the models were available. This database include experiments from wheat producing North Eastern Plain Zone of India. These experiments conducted between years 2005 – 2010.
Data and Analysis
Deviation statistics: To study the observed and simulated Modeling index of agreement (d), RMSE and NRMSE are the different deviation statistics which are used to test the performance of model simulated data with the observed data.
The index of agreement, d(0 < d < 1), is a dimensionless and bounded measure originally provided by Willmot (1982). It has been recommended by many modelers to conduct cross-comparisons between simulated and observed data (Legates and McCabe 1999; Krause et al.2005; Moriasi et al.2007).

Similar to EF, dstatistic is a sum of squares-based, dimensionless statistics, mainly used to depict the degree to which the deviation toward zero. Both statistics are suitable to compare accuracies of many output variables together.
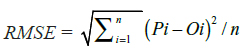
RMSE (Root Mean Square Error): The Root Mean Square error is a frequently used measure of the differences between values predicted by a model and the values observed. It is calculated by formula,
NRMSE (Normalized Root Mean Square Error):
The NRMSE can be interpreted as a fraction of the overall range that is typically resolved by the model. It is calculated by formula,
NRMSE= RMSE/y
DSSAT
DSSAT (Decision Support System for Agrotechnology Transfer) is a Computer Program to Analyze Multiple-Season Crop Model Outputs. Computer simulation models of the growth, development, and yield of annual crops can produce large quantities of data, especially if a simulation experiment involves many treatments and replications across different years. DSSAT can perform simple analyses of such experiments, allowing the user to identify those treatments that are productive, stable, economically attractive, environmentally sound, or otherwise suitable for the purposes of the investigator. It can interface with output files produced by any crop model run on any other computer that conforms to a common output file structure. Summary statistics for a wide variety of model output variables are calculated and presented to the user in a number of tabular and graphical forms. Net monetary returns and gross margins can also be calculated, and price-cost variability can be taken into account in the analysis. The user can perform an economic comparison of simulation treatments. (Thornton and Hoogenboom 1994).
Model Description
DSSAT
DSSAT, which is developed by International Benchmark Sites Network for Agrotechnology Transfer (IBSNAT) in USA, is a software tool that enables sub – models to be linked to simulate agricultural systems.
CERES
CERES-Wheat is a yield simulation model that was originally developed under the auspices of the USDA-ARS Wheat Yield Project and the U.S. government multiagency AGRI-STARS program (Ritchie and Otter, 1985). The model is also one of the main models that have been incorporated in DSSAT (Hoogenboom et al. 1994). The CERES-Wheat model simulates the impacts of the main environmental factors, such as weather, soil type, and major soil characteristics, and crop management on wheat growth, development, and yield (Ritchie et al.1998).
Input requirements for CERES-Wheat include weather and soil conditions, plant characteristics, and crop management (Hunt et al.2001). The minimum weather input requirements of the model are daily solar radiation, maximum and minimum (Hutchinson 1991; Racsko et al.1991) can use climate air temperature, and precipitation. These values are usually available at many locations with the exception of solar radiation. However, solar radiation can be approximated from other observations, such as the number of sunshine hours, which is sometimes more readily available. Soil inputs include drainage and runoff coefficients, first-stage evaporation soil albedo, water-holding characteristics for each individual soil layer, and rooting preference coeffcients at several The model also requires saturated soil water condition, and precipitation and initial soil water content for the first day of simulation. Required crop genetic inputs are coeffcients related to photo- period sensitivity, duration of grain filling, conversion of mass to grain number, grain-filling rates, vernalization require-weather data to determine its input coefficients stem size, and cold hardiness (Hunt et al.1993). Check management input information includes plant population, planting depth, and date of planting. If the crop is irrigated, the date of application and amount is required. Latitude is required for calculating day length. The model can use different weather, soils, genetic, and management information within a growing season or for different seasons in a single model execution. The model simulates phenological development; biomass accumulation and partitioning; leaf area index LAI); root, stem, leaf, and grain growth; and the soil and plant water and Nbalance from planting until harvest maturity
based on daily time steps (Godwin and Singh 1998; Ritchie 1998; Ritchie et al.1998).
CALIBRATION
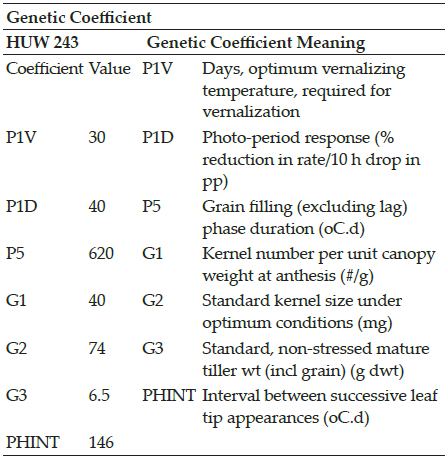
Treatments which having adequate fertilization were selected to calculate the genetic coefficients of HUW - 243 variety of wheat used in the present analysis. These experiments were conducted o the different locations of North Eastern Plain Zone of India. For the simulation of a crop variety, the crop model requires genetic coefficients. Detailed physiological experiments in field are needed to directly estimate their values. The genetic coefficients of different varieties for the CERES model were estimated by repeated iterations until a close match between simulated and observed phenology, growth and yield was obtained. These coefficients were used in the subsequent validation and application. Among them, one treatment used to calibrate Yield. These treatments were also not considered for the validation.
VALIDATION
The data of all treatments not used for calibration was used for the validation. Management practices relating to dates of seeding and plant population, spacing and irrigation as measured in the different treatments were used in the simulation. Table 1 shows the different genetic coefficients of wheat variety. An experiment conducted at Varanasi was utilized for validation of the temporal changes in leaf area index and dry mater.
RESULTS AND DISCUSSION
Duration of Flowering
The correct estimation of flowering date is very crucial for the success of crop simulation model. Observed flowering duration varied from 96 (in Varanasi) to 104 (Sabour) days where as simulated duration raged from 101 (in Varanasi) to 110 (Sabour) for CERES model. (Fig. 1) showed that model were able to simulate flowering period reasonably well for most treatments with d – Index value .970. Nevertheless, most of the simulated values were within 15% error lines for model except some treatments where the simulated values had larger error. These were the experiments conducted in Varanasi.
3.3.GRAIN YIELD
(Fig. 3b) shows a close correspondence between simulated and observed grain yields across all treatments of locations, seasons, varieties and management for model. Observed grain yields ranged from 642 kg ha-1 (Pantnagar) to 2265 kg ha-1(Ludhiana) depending upon the location whereas simulated grain yields ranged from 580 kg ha-1(Pantnagar) to 1984 kg ha-1 (Ludhiana). Model shows very high d – Index value about 0.961.
The simulated response was even smaller. One possible reason for this could have been the limited calibration and initialization of the model. It is evident from the figure that CERES model predicted grain yields within 15% of the measured yields.

CONCLUSION
Model simulated the trends in the grain yield and phenology as measured in diverse field experiments. There were, however, deviations as large as 15% in some cases. Experiments were available for the validation of temporal changes in LAI and biomass. Days to anthesis, first seed, first pod, days to maturity, leaf area index were satisfactorily simulated by DSSAT model, however leaf area index was underestimated and rest of the parameters was over estimated by the model with reasonable agreement (15 %). DSSAT model has proved to be valuable tool for predicting wheat yield. Therefore, the validates DSSAT can used for applications such as prediction of crop growth, phenology and actual yield, performance of wheat under climate change study etc. The model may also be used to improve and evaluate the current practices of wheat growth management to enhance wheat production. The precision with which field measurements used in this analysis were usually between ±10 and ±15%. The treatments used in the study widely varied in weather conditions, particularly in the temperatures and management practices. Considering these it can be concluded that models perform satisfactorily and are adequate to simulate the effects of climate change on wheat yields.
REFERENCES
Blanco-Canqui, H. and Lal Rattan. 2008. Principles of soil conservation and management.
Census of India htp://censusindia.gov.in/2011-Common/CensusData2011.html.
Climate change 2013. The physical Science Basis,htps://www. ipcc.ch/report/ar5/wg1/.
Feenstra, R.C 1998. Integration of Trade and Disintegration of Production in the Global Economy, Journal of Economic Perspectives,pp 31–50.
Giorgi, F. et al.2012. RegCM4: model description and preliminary tests over multiple CORDEX domains. Clim. Res.,52: 7–29.
Godwin, D.C. and Singh, U. 1998. Nitrogen balance and crop response to nitrogen in upland and lowland cropping systems, Understanding Options for Agricultural Production,pp. 55-77.
Hoogenboom, G., Jones, J.W., Wilkens, P.K. and Batchelor, W.D. 1994. Crop Models,pp. 95- 244.
Hunt, L.A., Pararajasingham, S., Jones, J.W., Hoogenboom, G., Imamura, D.T. and Ogoshi, R.M. 1993. GENCALC-software to facilitate the use of crop models for analyzing field experiments. Agron. J.,85: 1090-1094.
Hunt, L.A., White, J.W. and Hoogenboom, G. 2001. Agronomic data: advances in documentation and protocols for exchange and use. Agric. Sys.,70: 477–492.
Hwang, J.N., Lay, S.R., Maechler, M., Martin, D. and Schimert, J. 1994. Regression Modeling in Back-Propagation and Projection Pursuit Learning, IEEE Trans. on Neural Networks,5(3): 342-353.
Jayaraman, T. and Murari, K. 2014. Climate change and Agriculture: Current and future trends and implications for India. Review of Agrarian Studies,4(1): 1-49.
Khan, A.S., Sanjeev, K., Hussain, M.Z. and Kalra, N. 2009. Climate Change, Climate Variability and Indian Agriculture: Impacts Vulnerability and Adaptation Strategies, Climate Change and Crop,pp. 19-38.
Ritchie, J.T. and Oter, S. 1985. Description and performance of CERES-Wheat: a user-oriented wheat yield model. Crop Husbandry, pp. 159-175.